My updates have been cleared again. This must be something I do in setting up the servers, some misunderstanding on my part.
Can I just run through the update scripts I run?
Firstly, I amend the checks I require:
UPDATE [dbo].[sqlwatch_config_check] SET [check_frequency_minutes] = 60, user_modified = 1
WHERE check_description like 'The "Free Space %" value is lower than expected.%'
Because of this issue, I also update the check template table so that when I experience one of these resets, at least the check values will be correct, but I’ve found the user_modified setting doesn’t get set back on the sqlwatch_config_check table:
UPDATE [dbo].[sqlwatch_config_check_template] SET [check_frequency_minutes] = 60, user_modified = 1
WHERE check_description like 'The "Free Space %" value is lower than expected.%'
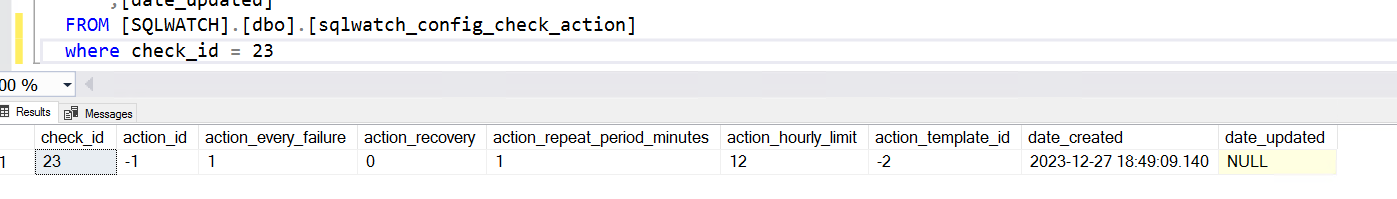
Then for each required check I insert the required actions:
--check\action association
declare @check_id bigint, @check_name nvarchar(255)
SELECT @check_id = min( check_id ) FROM [dbo].[sqlwatch_config_check] where check_description like  'The "Free Space %" value is lower than expected.%'
WHILE @check_id IS NOT NULL
BEGIN
SELECT check_id, @check_name FROM [dbo].[sqlwatch_config_check] WHERE check_id = @check_id
INSERT INTO [dbo].[sqlwatch_config_check_action]
		   ([check_id]
		   ,[action_id]
		   ,[action_every_failure]
		   ,[action_recovery]
		   ,[action_repeat_period_minutes]
		   ,[action_hourly_limit]
		   ,[action_template_id]
		   ,[date_created]
		   ,[date_updated])
	 VALUES
		   (@check_id
		   ,-4 	-- this is action_id of the run disk utilisation report (action_report_id -4)
		   ,1 	-- action will happen on check failure
		   ,0 	-- don't run a recovery email when disk above 10%
		   ,60 	-- mins before next action alert (nag)
		   ,1 	-- number of nags per hour
		   ,-2 	-- this is the default action template to use for email reports
		   ,getdate()
		   ,getdate())

SELECT @check_id = min( check_id ) FROM [dbo].[sqlwatch_config_check] WHERE check_id > @check_id AND check_description like  'The "Free Space %" value is lower than expected.%'
END;
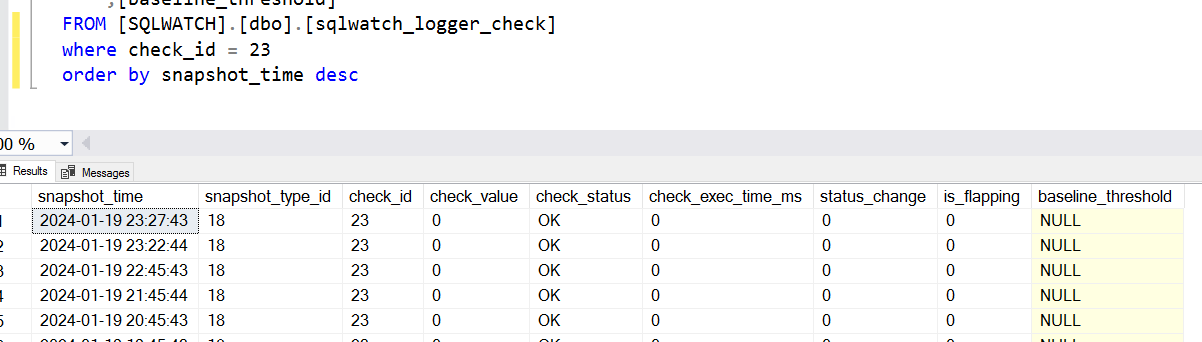
This all seems to work for a while but at some point the sqlwatch_config_check table is reset and the sqlwatch_config_check_action is cleared leaving only the default blocked process report (check__id -2) so I no longer get any alerts.
Other people are seemingly using SQLWatch so I’m assuming I’m doing something fundementally wrong when I set the servers up.
Thanks in advance for any help you can give on this.
Shaun