Since a couple of days, I started receiving alerts from my sql server as follows
DATE/TIME: 16/02/2022 09:07:25
DESCRIPTION: The transaction log for database ‘SQLWATCH’ is full due to ‘ACTIVE_TRANSACTION’.
COMMENT: statement caused SQL Server to run out of resources (such as memory, locks, or disk space for the database) or to exceed some limit set by the system administrator.
I have no issues with resources on the sql box, after googling, I backed up the sqlwatch DB, restarted the server but always getting this alert.
Can you please help?
Do you think there is a problem with transaction management, i.e we don’t close a transaction (in which case please provide which version you are running)? Or, is your SQL mismanaged and you don’t take log backups? To log backup or not to log backup • SQLWATCH.IO
I am not here to tell you that you are doing it wrong. Either change the recovery model to SIMPLE or start taking Log backups. Make sure you know what you are doing and whatever you do, make sure you comply with your company RTO and RPO requirements.
It is already in simple mode. For specific DBs I do not need a backup for logs such as sqlwatch unless it solves this issue. But tell me please, why a full backup I did yesterday does not solve the issue?
a full backup has nothing to do with transaction backups. If you are running the database in simple mode but the log keeps growing, there is an issue with the application and the transaction handling. I have not had a report about a similar issue so you would have to help me debug it.
If you could run:
DBCC opentran()
and
SELECT * FROM sys.sysprocesses WHERE open_tran = 1
and let me have the output that would be great. Also, please run it multiple times to make sure that if you do capture an open transaction it’s open for a long time.
No active open transactions.
DBCC execution completed. If DBCC printed error messages, contact your system administrator.
Completion time: 2022-02-16T18:19:13.7262493+01:00
The 2nd statement gives nothing
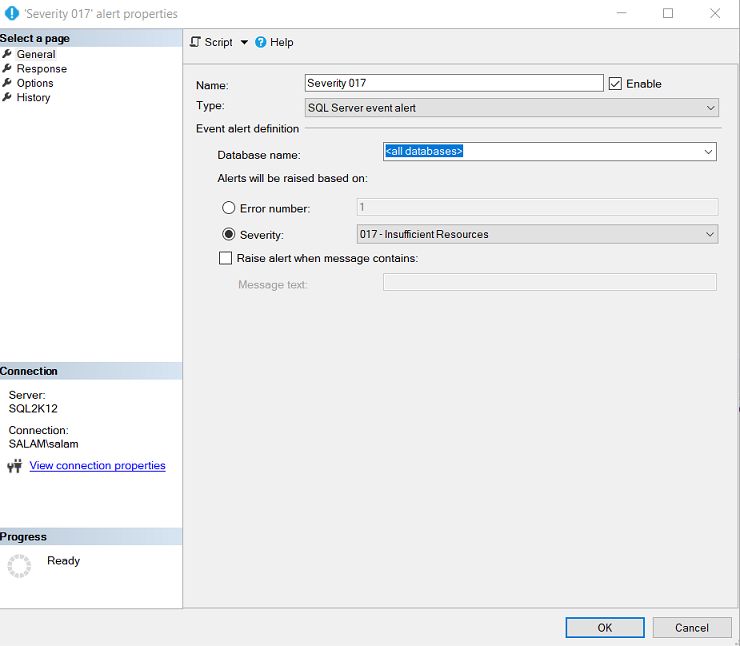
The alert is sent because I have an alert configured as follows
it doesn’t add up
can you show me output from the below:
select name, recovery_model_desc
from sys.databases where name = 'SQLWATCH'
never mind - the 2.15 is % free - sorry you cut the header and it made me think its 2.15GB size and 1.9GB full.
Looks good to me. Perhaps you had a one-off big transaction (still would seem rather big for sqlwatch)
The best thing is that you can track this in sqlwatch itself so you can see how the space is being consumed. If its a one off then I wouldn’t worry about it.
I did
Select * from [dbo].[sqlwatch_logger_disk_utilisation_database]
I have 323 922 rows since 2021-07-21.
Is it a good idea to truncate some of those rows for example half of it? isnt there any param to limit data in sqlwatch for example only 30 days or less?
You can’t truncate half the rows. You would need to delete them. It’s probably best to get familiar with how retention works in SQLWATCH: Configuration | sqlwatch
I read th docs, thanks and I changed 3 config from 365 to 30 days. I wanted to run
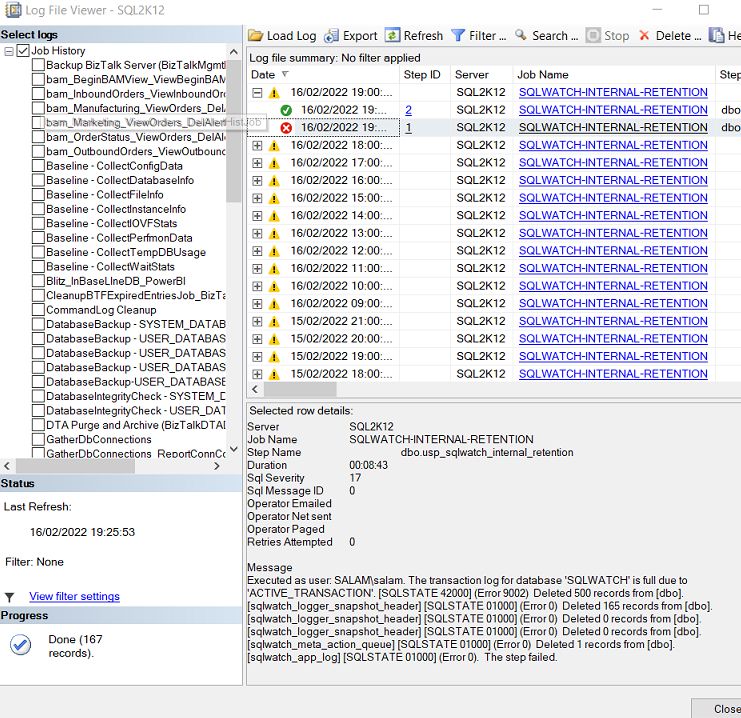
SQLWATCH-INTERNAL-RETENTION
job, I found that it is not working due to the same error
in that case, I suppose what happens is that because you have so much data and the retention job didn’t run in a long time, it is now trying to delete too much data at once, filling up the transaction log.
You can do one of the three things:
Change the retention batch size in the config table (Logger Retention batch size) to something less than 500. Say 100 or even less.
temporarily increase the size of the transaction log
delete data manually (this may be difficult due to foreign keys)