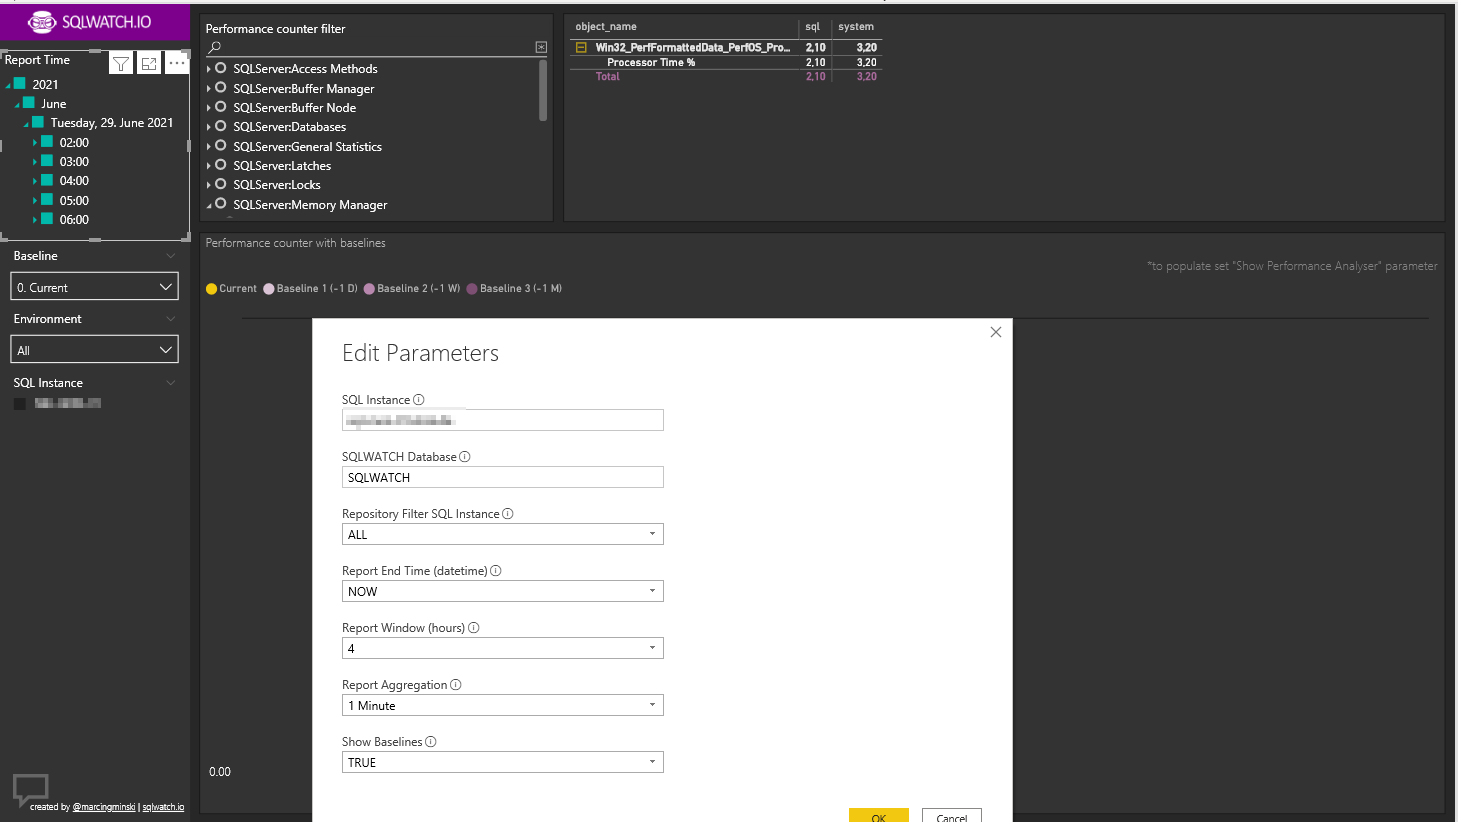
Hi, one thing I have not found in the documentation is where to set this parameter:
![]()
Appreciate advice 
Hi, one thing I have not found in the documentation is where to set this parameter:
![]()
Appreciate advice
Hi Jonas,
Depending on the version of the PBI, the last tab is a generic performance counter chart that shows data without aggregation. As it can potentially generate substantial load on the server by reading lots of data, it’s controlled via separate “switch” in the PBI parameter. In other words, it is just another PBI parameter.
Hello all,
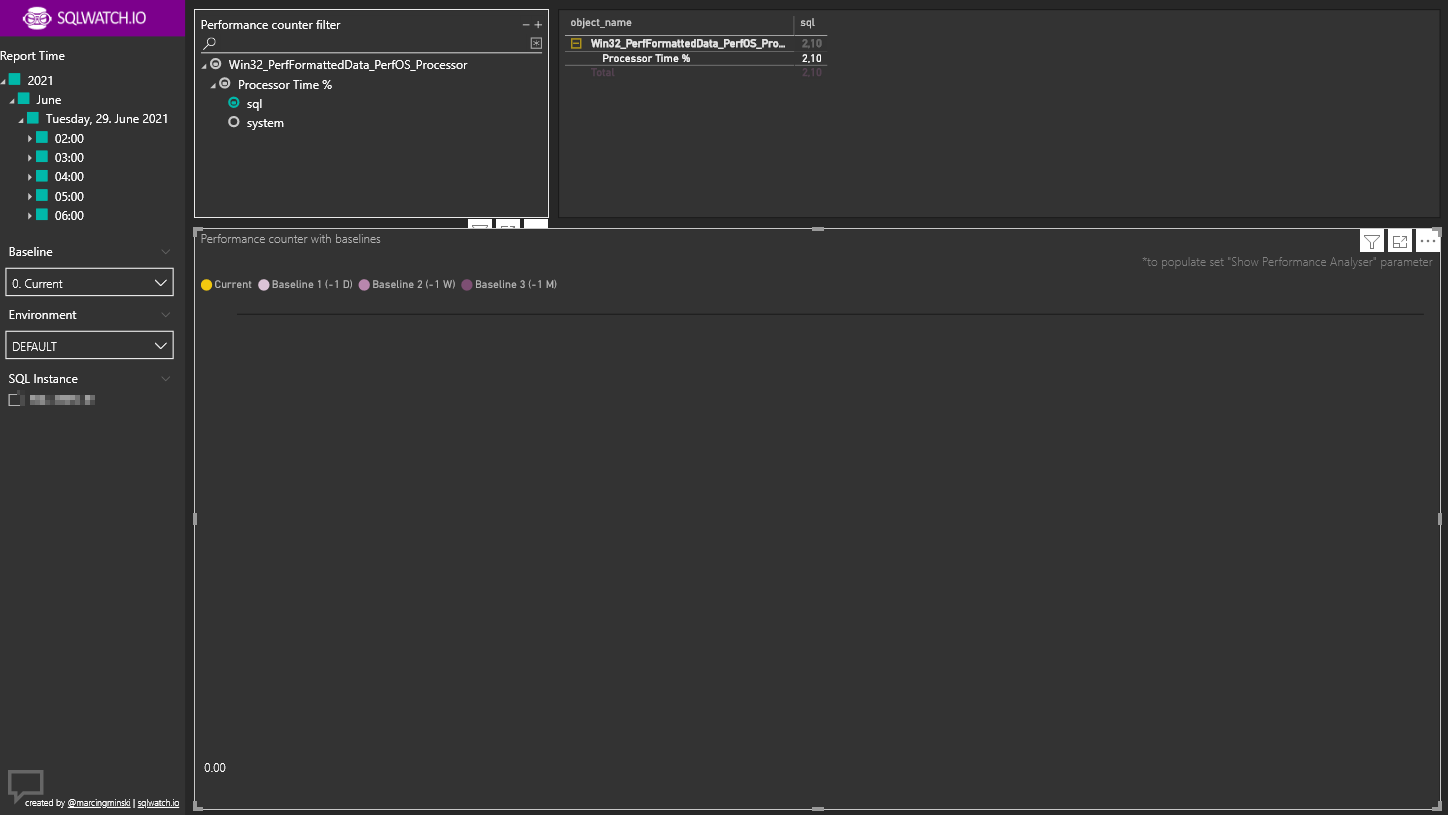
I have to revive this topic since I have the same “issue” with the Perf Analyzer Tab.
My settings look like this:
Best regards,
Dirk
Hi Dirk,
Not sure which version you have, but I just checked the latest and it is a bit confusing.
The dashboard tells to enable the “Show Performance Analyser” parameter but there is no such parameter. However, this message is now obsolete as the parameter was removed as it now always loads all counters. Have you checked all counters?
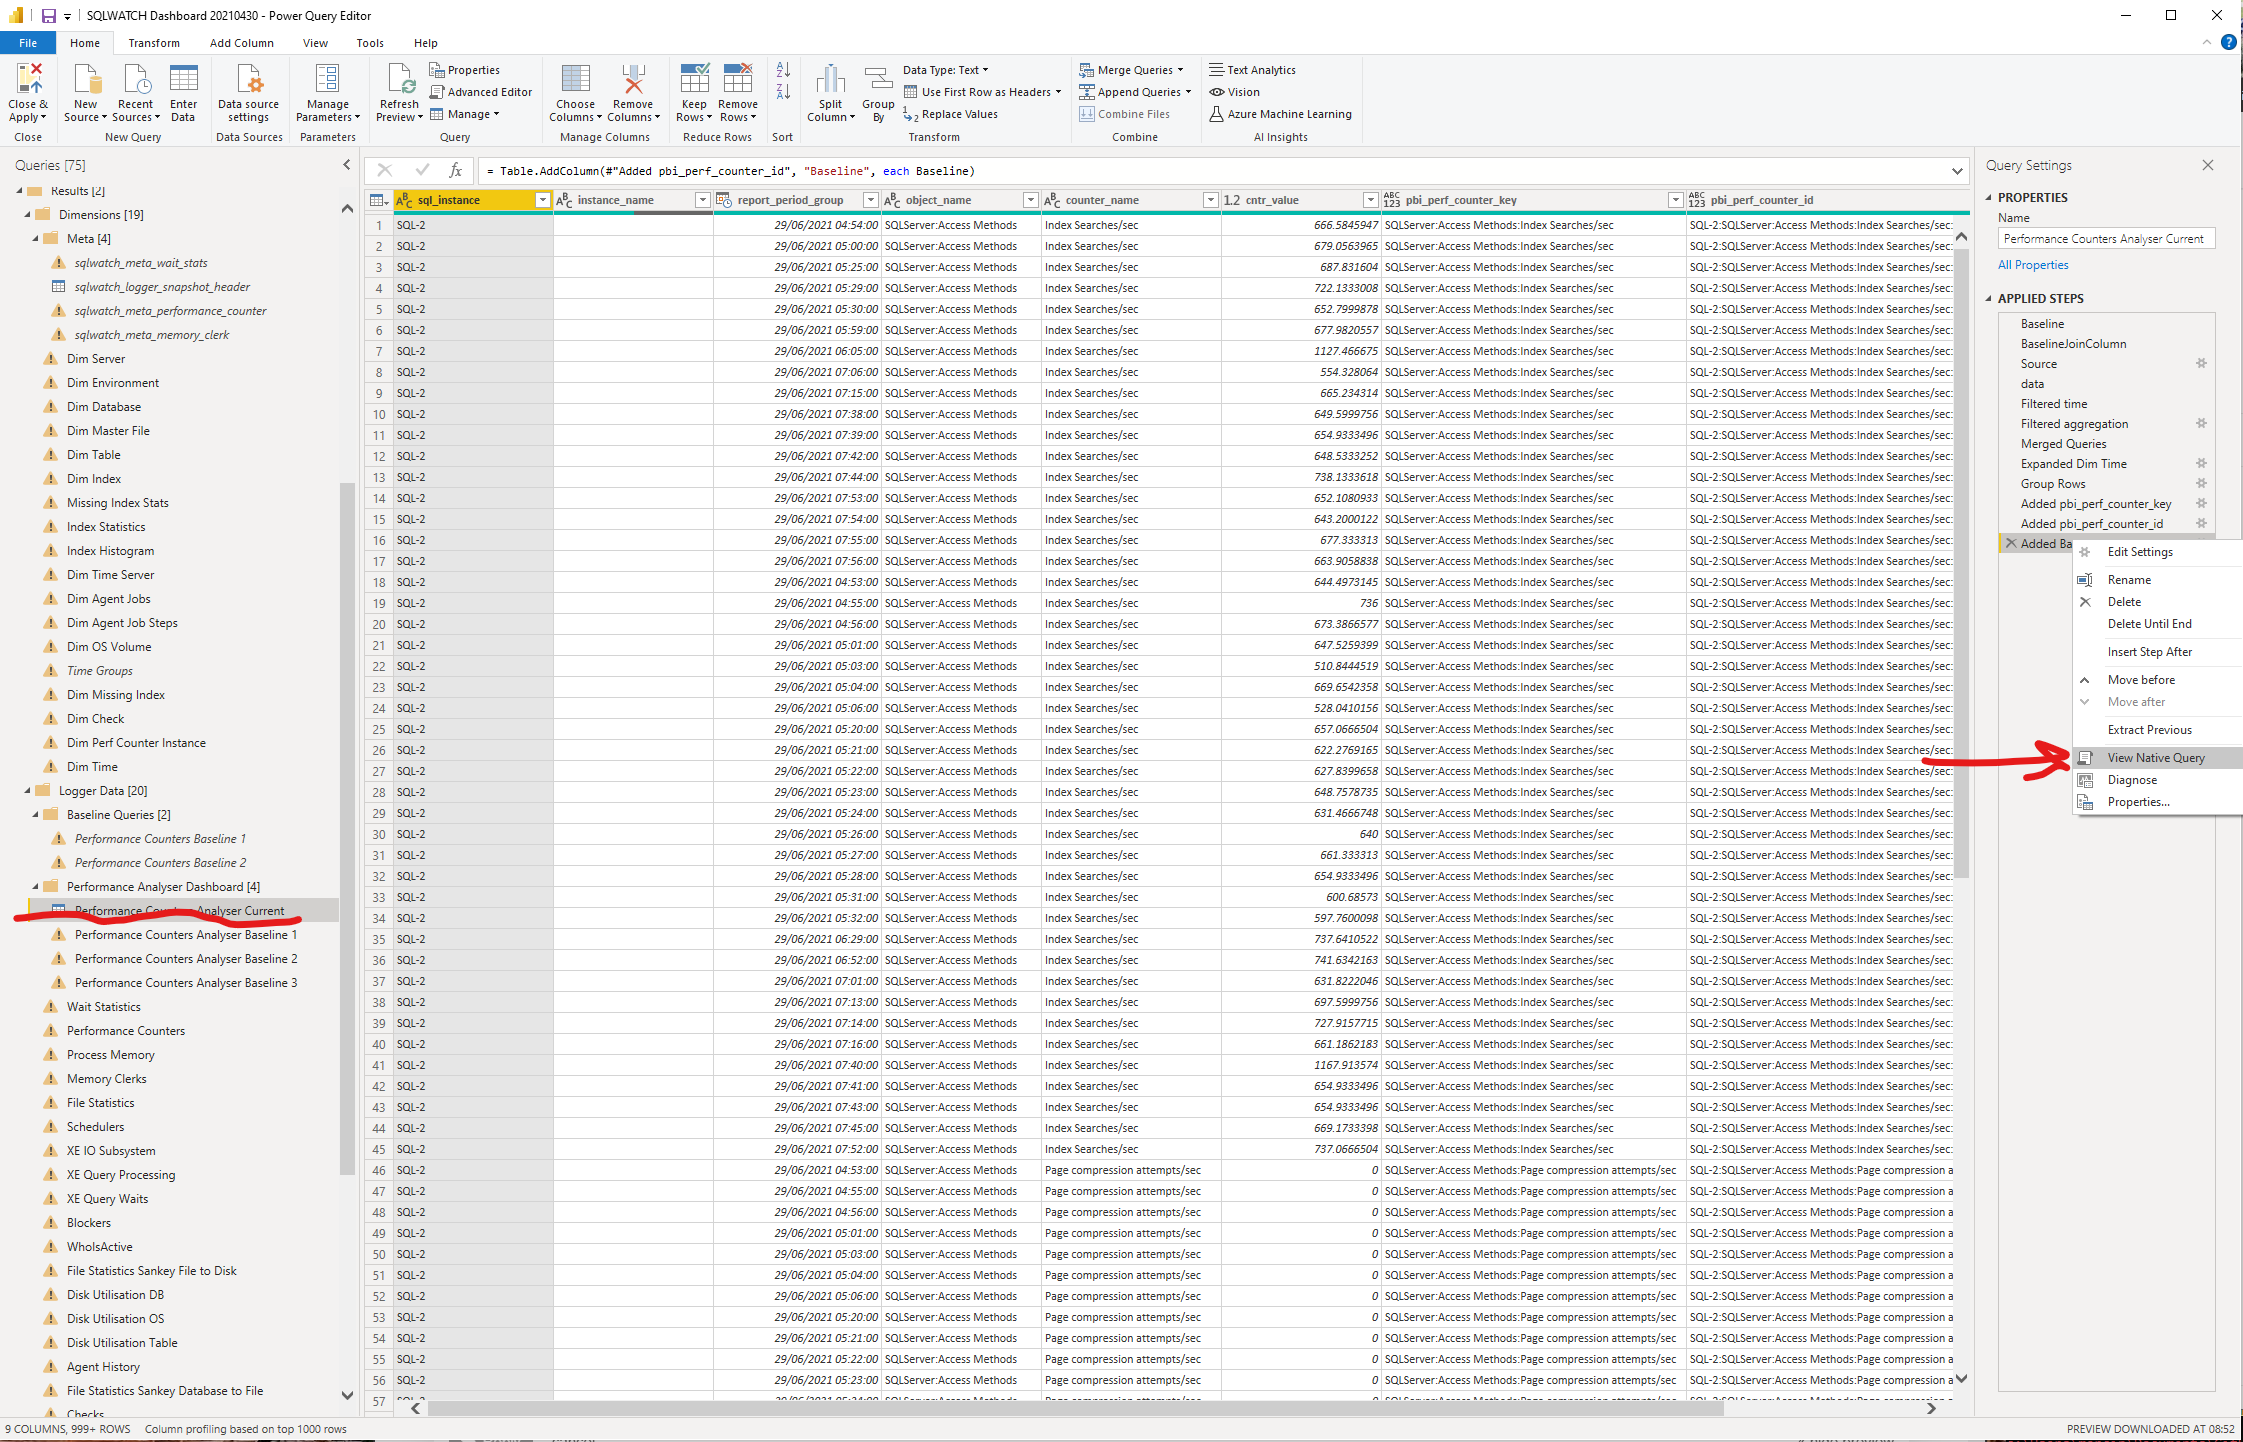
To debug this issue, if you go to the Query Editor → Logger Data → Performance Analyser Dashboard → Performance Counters Analyser Current and right click on the “Added baseline” step in the “Applied Steps” pane, you will be able to extract the actual SQL Code for it. You can then investigate why its not pulling any data.
Hi Marcin,
the whole query does not return any results.
I’ll dig into it, since this part of the query does return results:
select [].[sql_instance] as [sql_instance2],
[].[snapshot_type_id] as [snapshot_type_id2],
[].[snapshot_time] as [snapshot_time2],
[].[report_time] as [report_time2],
[].[date] as [date],
[].[year] as [year],
[].[month_name] as [month_name],
[].[interval_minutes_5] as [interval_minutes_5],
[].[interval_minutes_15] as [interval_minutes_15],
[].[interval_minutes_60] as [interval_minutes_60],
[].[baseline_1_report_time] as [baseline_1_report_time],
[].[baseline_2_report_time] as [baseline_2_report_time],
[].[baseline_3_report_time] as [baseline_3_report_time],
[].[baseline_1_snapshot_time] as [baseline_1_snapshot_time],
[].[baseline_2_snapshot_time] as [baseline_2_snapshot_time],
[].[baseline_3_snapshot_time] as [baseline_3_snapshot_time],
convert(datetime2, [].[report_period_group]) as [report_period_group]
from
(
select [].[sql_instance] as [sql_instance],
[].[snapshot_type_id] as [snapshot_type_id],
[].[snapshot_time] as [snapshot_time],
[].[report_time] as [report_time],
[].[date] as [date],
[].[year] as [year],
[].[month_name] as [month_name],
[].[interval_minutes_5] as [interval_minutes_5],
[].[interval_minutes_15] as [interval_minutes_15],
[].[interval_minutes_60] as [interval_minutes_60],
[].[baseline_1_report_time] as [baseline_1_report_time],
[].[baseline_2_report_time] as [baseline_2_report_time],
[].[baseline_3_report_time] as [baseline_3_report_time],
[].[baseline_1_snapshot_time] as [baseline_1_snapshot_time],
[].[baseline_2_snapshot_time] as [baseline_2_snapshot_time],
[].[baseline_3_snapshot_time] as [baseline_3_snapshot_time],
[].[report_time] as [report_period_group]
from [dbo].[vw_sqlwatch_report_dim_time] as []
where [].[snapshot_time] >= convert(datetime2, ‘2021-06-29 05:05:21’) and [].[snapshot_time] <= convert(datetime2, ‘2021-06-29 09:05:21’)
) as []
The outer query also works but not with aggregation_interval_minutes = 1
So that is the failing part right now since I do not have any records with interval_minutes = 1
Now I have to figure out why that’s the case.
What version do you have?
In the recent version, the 1 minute aggregation is done in the trends tables and the “current” tables have aggregation of 0
I suppose that’s a bug in the dashboard then.
Version 4.2, installed with dbatools.
Interesting thing is that the table sqlwatch_trend_perf_os_performance_counters is empty.
I vaguely remember that there was a warning during the deployment. Maybe I will redeploy sqlwatch and check again at a later stage.
does the “trends” job run?
Ha! Now we are getting closer. The Job is not there…
It really seems that a redploy makes sense or the deployment against another test server
I have redeployed the solution through dbatools. Now with the trends jobs. So that was the missing link.
I’ll check the report this afternoon or tomorrowafter a few hours of data collection.
Good to know!
Keep me updated!
Hi again,
report still does not work but I’m getting closer. It seems that the JOIN PowerBI uses between outer and inner table does not work.
The thing is: the inner query returns for snapshot_time2 values like 2021-06-29 11:29:02,eg snapshot is not taken exactly at zero seconds.
On the other hand, the outer qry returns something like 2021-06-29 11:29:00 .
So the join on snapshot time cannot return any rows because there’s no match.
…
as [$Inner] on
(([$Outer].[sql_instance] = [$Inner].[sql_instance2] and [$Outer].[snapshot_type_id] = [$Inner].[snapshot_type_id2]) and [$Outer].[snapshot_time] = [$Inner].[snapshot_time2])
I have changed the agent job now to run exaclty from 00:00:10 on in a 10 sec interval. So I’ll minimize/mitigate the offset . Maybe it does the trick.
1st little test now returns some rows. So more tomorrow
Regards
Dirk
The problem is that this query is using trends but it should not.
Trends are rounded up to the nearest minute. It should just use aggregation_interval_minutes = 0 instead of aggregation_interval_minutes = 1 without any other changes
Ah, understand.
So it is really somehow Dashboard related.
I will take another look tomorrow. Maybe I get an idea of what is happening.
What’s happening is that since 4.2, the performance collection is every 10 seconds and thus the lowest aggregation is now at 0 minutes. Previously the collection was every 1 minute so the lowest level of aggregation was 1 minute.
The dim_time is based on the header table, which means is just derived from the actual collection times. The trends table on the other hand is aggregated at 1, 5 or 60 minutes and rounded-up to the nearest minute and thus seconds are always 00
For that reason, the dashboard queries that join onto the dim table must use the aggregation of 0 i.e. the actual time, no rounded-up time.
In other words, It’s a bug in the dashboard.