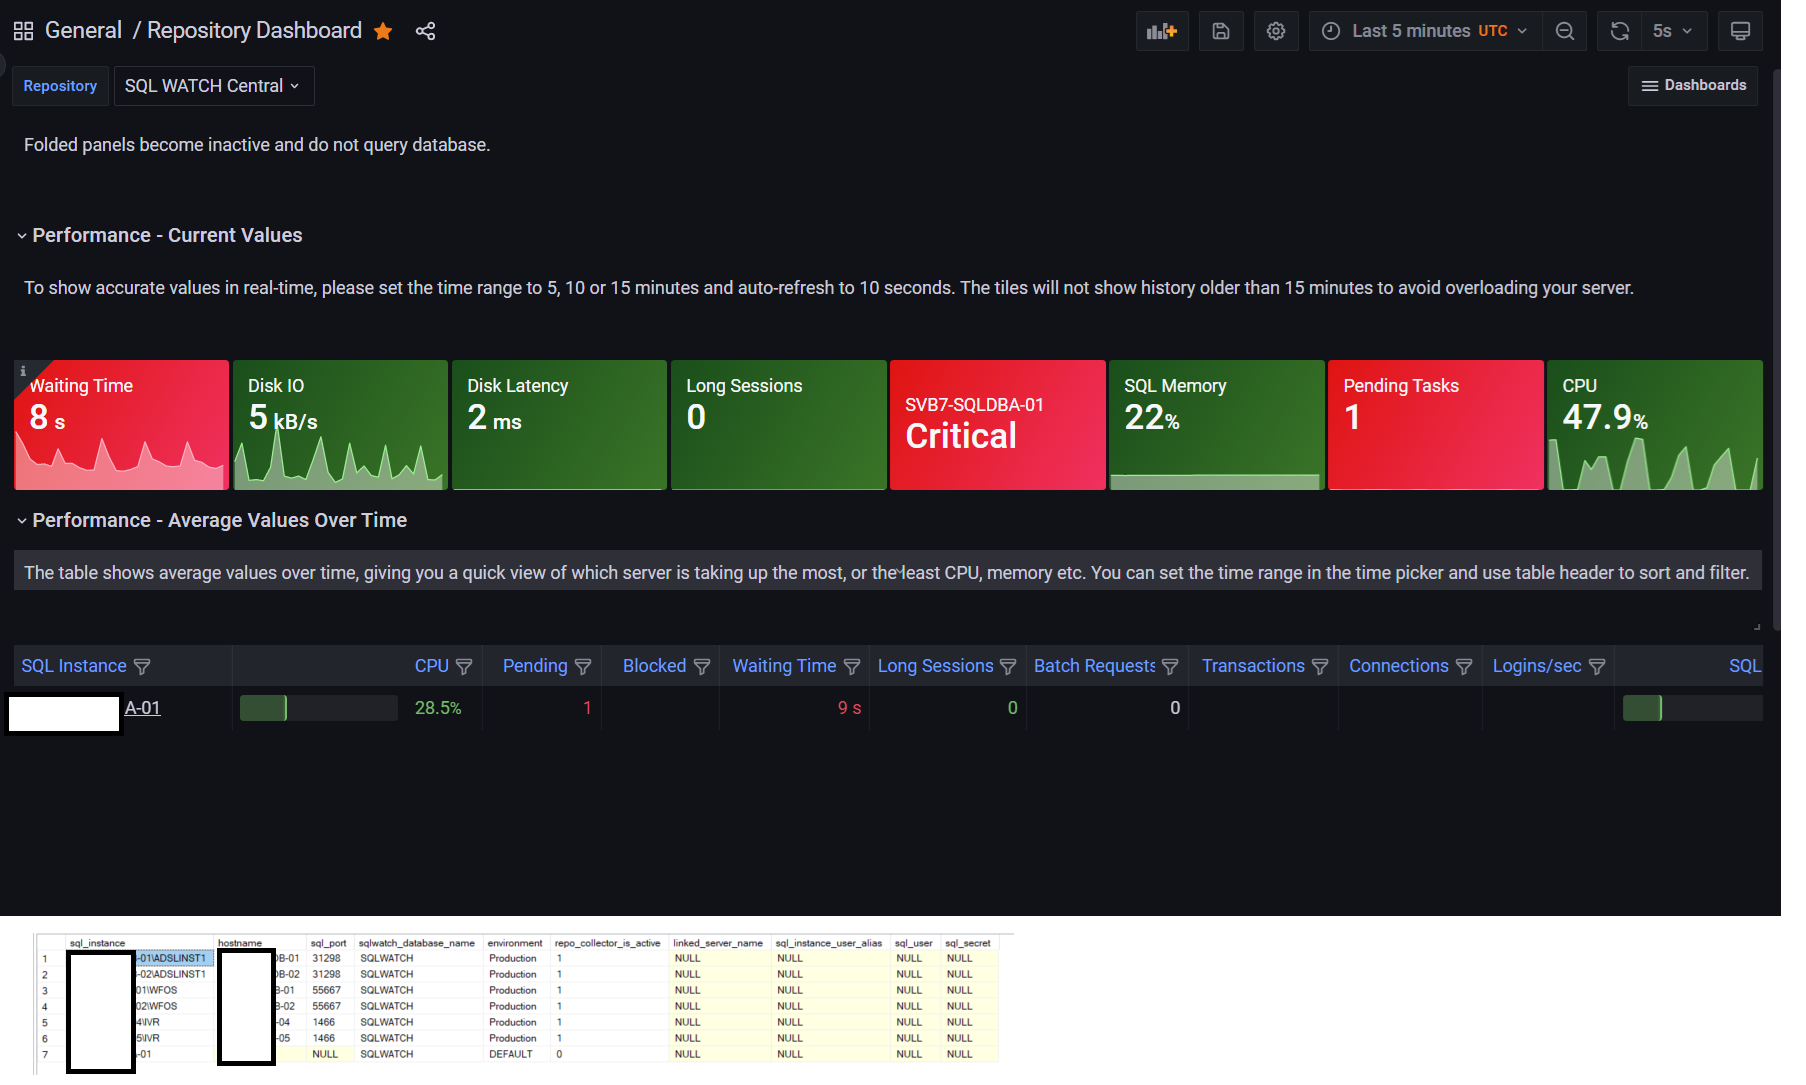
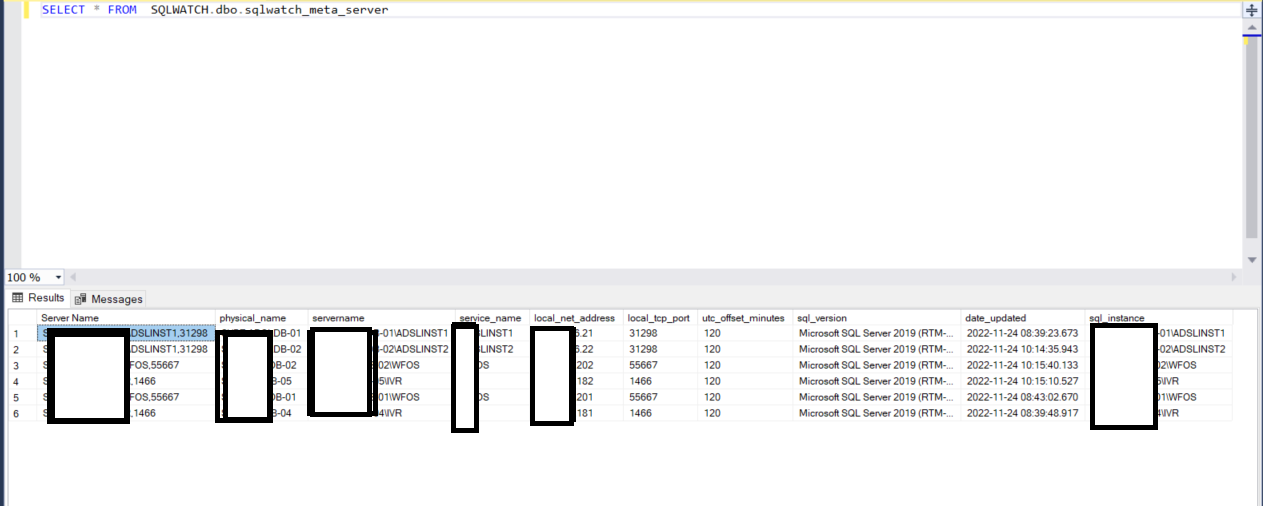
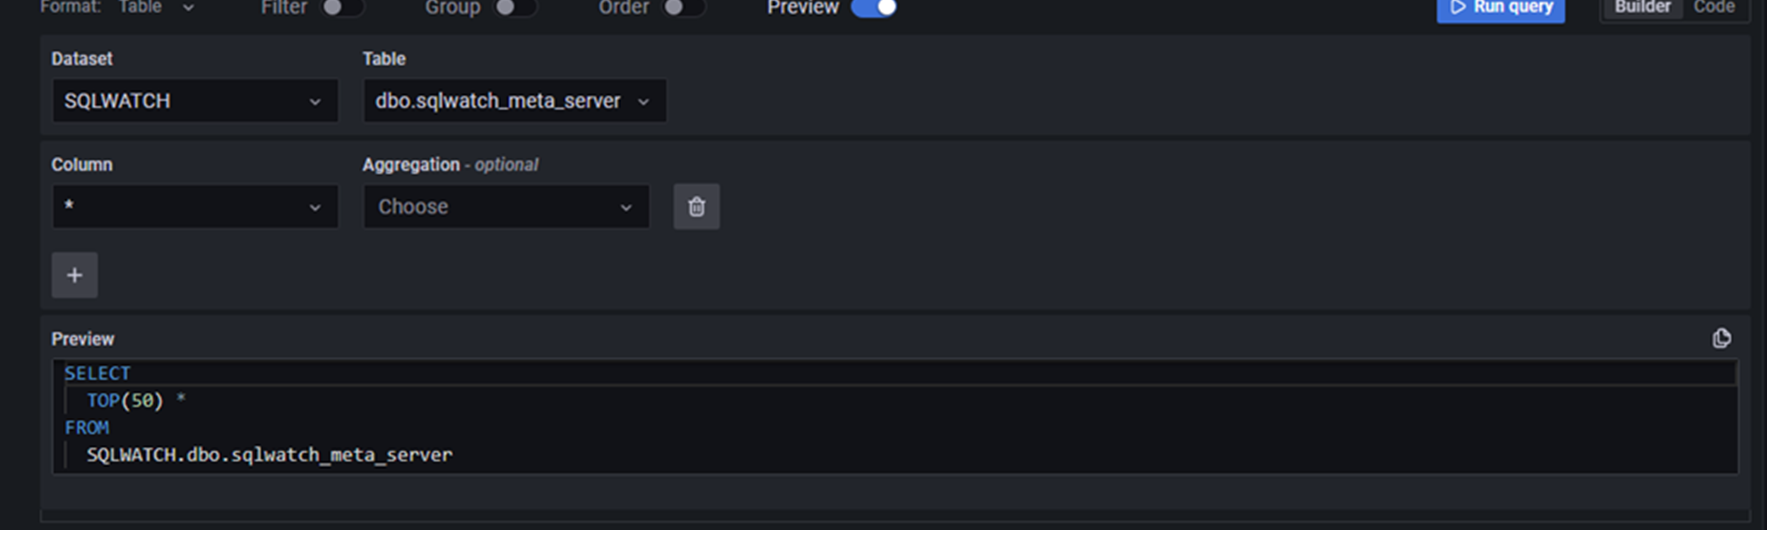
the bottom table looks to be the [dbo].[sqlwatch_config_sql_instance] can you execute the query from Grafana (edit dashboard and preview the query), alternatively, can you see what’s in the [dbo].[sqlwatch_meta_server] table?
Thanks. When you go to Grafana, click on Edit Panel and then Query Inspector to see the query Grafafna generated. Can you run this query in SQL and see what it returns?
In other news, I did another deployment and the meta table has only the default monitoring instance (while the imports are successful from the linked servers).
Any ideas