The transaction log for database 'SQLWATCH' is full due to 'ACTIVE_TRANSACTION'

Since a couple of days, I receive alerts indicating SQLWATCH

The transaction log for database ‘SQLWATCH’ is full due to ‘ACTIVE_TRANSACTION’.

I do in SQLWATCH

dbcc opentran

I get

Transaction information for database ‘SQLWATCH’.

Oldest active transaction:
SPID (server process ID): 53
UID (user ID) : -1
Name : DELETE
LSN : (65270:115008:1)
Start time : Sep 6 2022 4:45:42:950PM
SID : 0x010500000000000515000000b0ad624cea76d9b0107863e451040000
DBCC execution completed. If DBCC printed error messages, contact your system administrator.

Completion time: 2022-09-06T16:58:42.8394491+02:00

I killed the spid and ran manually
exec dbo.usp_sqlwatch_internal_retention

it never finishes, dbcc opentrans gives the same thing with another spid

Oldest active transaction:
SPID (server process ID): 58
UID (user ID) : -1
Name : DELETE
LSN : (65270:115008:1)
Start time : Sep 6 2022 4:45:42:950PM
SID : 0x010500000000000515000000b0ad624cea76d9b0107863e451040000
DBCC execution completed. If DBCC printed error messages, contact your system administrator.

after 20 minutes I broke the job again. Can you please help on how to finish with this ‘ACTIVE_TRANSACTION’ sitting there whatever I do, I did a backup(DB is in simple mode), shrink…but nothing helped

Hi nobody can answer this?

Hi,

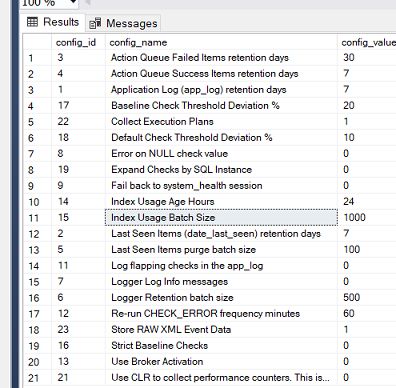
The answer is that the retention job is likely to be deleting too much data at once. You can try changing batch options in the config table. Can’t remember from top of my head the exact item, but it should be self-explanatory when you see it.

Thanks marci, do you mean decrease
“Index Usage Batch Size” which is currently the default 1000 to something like 500?

sqlwatchConfig

It will be the Logger Retention batch size. Try setting this to 100 or less and see how it goes.

This did not help, still getting the same alerts. What is strange, I do a full backup, I see unused space in Transaction Log around 90%, 30-45 minutes later I see unused space or 10%.

It is true that sqlwatch DB is in simple mode and I do regularly 1 full backup every Friday, can this be the root cause?

SIMPLE mode is fine.
How much data do you have? How big is the database?

Data 4.341 Gig, Log initial size 150 Mega but it goes to 4 Gig as well

Even when Log file in state “95%” unused I get this same alert

Hi Marcin, any feedback? alerts never stops, this is becoming very annoying

Hi,

If the job still breaks I’d increase the size of the log file or let it grow automatically. Perhaps for whatever reasons it needs all this space.

If you keep it simple mode there shouldn’t be any impact.

I can’t suggest more without looking at a database I’m afraid.