We have installed SQLWatch on several instances on azure. We have had this issue with SQLWatch consuming CPU most of the time and its always above 90%.
Currently i am trying to diagnose issue on a vm with 8 vCPU and 32gb RAM. Hardisk space is well over 100gb.
SQLWATCH version is 2.5.7460.35921
I had to shutdown the SQLWatch because it was draining the CPU. I was wondering if anyone else is facing the same issue here?
Can you please be more specific, which jobs are causing the CPU go up? When yous say “shutdown SQLWATCH?” What do you mean? SQLWATCH are essentially just agent jobs that collect some data every few minutes.
Quite possibly it is the index jobs, if you have a lot of tables and indexes.
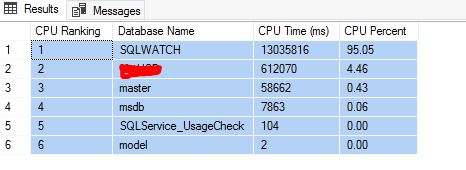
I don’t know which jobs are causing the Highest CPU utilisation. By shutdown i meant to say I had to put the SQLWATCH database “Offline” I ran a query to check which database was consuming so much CPU and SQLWATCH was always showing high. The question is this a normal behaviour ? attached an image for reference.
All this screenshot says is that the SQLWATCH is the most active database, and of ALL the CPU utilisation by SQL Server, it had 95%. It does not mean it caused the CPU to go up to over 95%. Can you show me the actual CPU utilisation either from the SQLWATCH itself or from the performance counter, or even from the task manager?
So i had to go back to the drawing board and look at the whole thing all over again. SQLWATCH was not an issue or causing the CPU high consumption. However, i noticed that there are two jobs agents , SQLWATCH_INTERNAL_CHECK and SQLWATCH_LOGGER_PERFORMANCE causing the cpu to spike 100% every 1 minute BUT for less than a second which i assume could be a normal behaviour.
I will close this discussion for now and thank you for your imput.
Just a little annotation to this thread:
I have the same experience. Looking through a diagnostic query it seems that SQLWatch Database is the top CPU consumer. Digging a bit deeper (Brent Ozars sp_blitzcache) I#ve found out that usp_sqlwatch_logger_xes_diagnostics ist the one. (sometimes runs for about 10-15 seconds)
It has to with the size of the file extended events session “system_health” . The session das a max file size of 100MB beofre the file rolls over. If the file is nearly full, then the proc really takes some time. Once there is a rollover, the job is fast again. This does not occur on a sql server 2014 though, since here the session is configured differently, e.g. max file size is just 5 MB.
The main time is the cast xml from sys.fn_xe_file_target_read_file though.
Yes. That’s a possibility with the default session, hence SQLWATCH comes with its own sessions. There has been a discussion about this on GitHub some time ago. Version 3 will further improve XE sessions.