Hello, I’m a relatively new DBA and I’m trying to setup sqlwatch in our environment.
I have the blocked process monitor setup to email me when blocking is detected and I thought I configured it to send me repeat alerts every 5 minutes with an hourly limit of 3, but this is not what I’m experiencing.
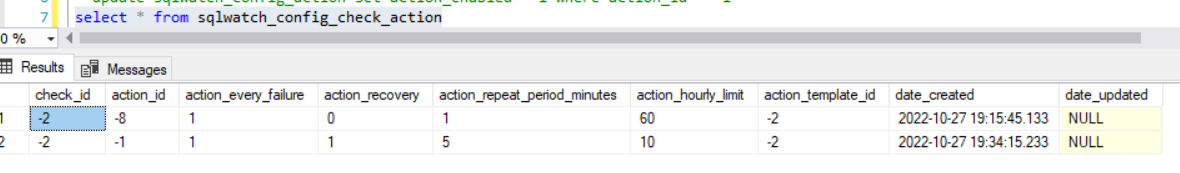
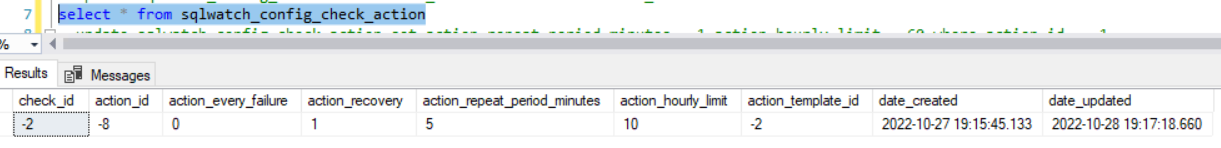
I created a row in sqlwatch_config_check_action as such:
check_id=-2
action_id=-1
action_every_failure=1
action_recovery=1
action_repeat_period_minutes=5
action_hourly_limit=3
action_template_id=-2
I create blocking to test this
(I run two queries, one in a transaction with TABLOCKX, HOLDLOCK and the other a normal select against the same table)
and I’m receiving two emails as the initial alerts, the only difference is the alert time is 207ms apart. If I check sqlwatch_logger_check, I can see the check triggering as CRITICAL check_status only once and at every minute as I would expect.
These two, nearly identical emails, are the only email notification I’ve received so far about 30 minutes later. I appreciate any help understanding how sqlwatch_config_check_action works to configure repeat and timing of notifications. I’ve read your posts here and on stackexchange, but I’m not having luck figuring out what’s wrong or making work as I’d like it to.
For what it’s worth, action_recovery does seem to work fine, which I really like.
To help with debugging, you can enable verbose logging with the below:
  update [dbo].[sqlwatch_config]
	set config_value = 1
  where config_name = 'Logger Log Info messages'
This will start logging quite a lot of info in the [dbo].[sqlwatch_app_log] table. You will have to dig out those relevant to this particular action/check and let me see it, please. Once done, disable the verbose logging:
  update [dbo].[sqlwatch_config]
	set config_value = 0
  where config_name = 'Logger Log Info messages'
|2022-10-21 16:01:43.6850376|usp_sqlwatch_internal_process_actions|F7A4AA65-1BE9-4D0B-8B1F-054CA1E24A6E|Action (Id:-8) calling Report (Id: -3)|ERROR|92|NT SERVICE\SQLSERVERAGENT|dbo|50000|16|1|dbo.usp_sqlwatch_internal_process_reports|281|Errors during execution of (usp_sqlwatch_internal_process_reports). Please review action log.|
|2022-10-21 16:01:43.6730246|usp_sqlwatch_internal_process_reports|E3796F4B-3C89-450E-8FC7-09926979074F|Error when executing Template Report (usp_sqlwatch_internal_query_to_html_table), @report_batch_id: NULL, @report_id: -3|ERROR|92|NT SERVICE\SQLSERVERAGENT|dbo|207|16|1|NULL|2|Invalid column name ‘blocking_start_time’.|
Then the only other rows I see that seem related all look like this (with different spids recorded):
2022-10-24 15:53:43.0596663 usp_sqlwatch_internal_process_checks 55C51822-5204-42B0-97A6-039608B9ACB8 Determining @check_status for Blocked Process (id: -2). We will try to use baseline data. We have NOT got any baseline data. The @check_status is null. The check value is 1.00000, the warning threshold is (null), and critical threshold is >0. The variance is 1. The final result is CRITICAL. INFO 80 NT SERVICE\SQLSERVERAGENT dbo NULL NULL NULL NULL NULL NULL
I don’t see any other rows that seem like they might be related to the blocked processes report, check, or alert.
For what it’s worth, I did update sqlwatch_config_reportset report_definition to some new code you shared with someone else who was having trouble with blocked process reports (that’s something else I was ignoring for now), so I’m not sure if maybe that affected something? I have put that report_definition value back the way it was just now though and no change in what alerts I’m getting.
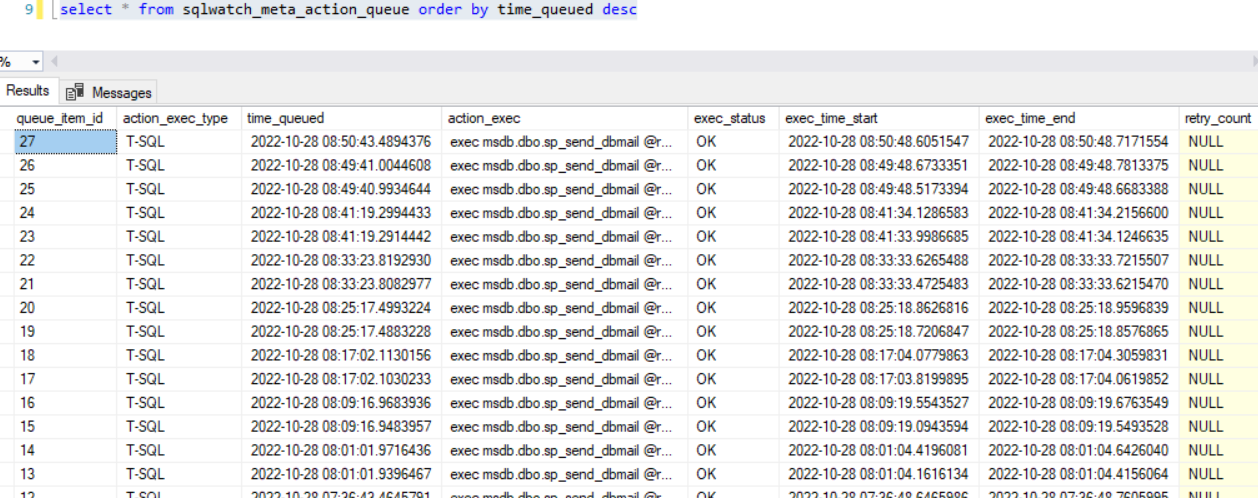
Looking at the sqlwatch_meta_action_queue table, I’m able to match up the rows to the emails I received; so, it appears that the emails I am receiving are timed exactly as they’re being generated out of sqlwatch.
Since SQLWATCH_INTERNAL_ACTIONS job appears to be correctly processing whatever is in sqlwatch_meta_action_queue, next step is to verify what’s going on with SQLWATCH_INTERNAL_CHECKS, right?
For what it’s worth, the extended properties on the SQLWATCH DB show I’m on version
4.2.0.28234
Note the previous test was cleared yesterday at 15:42 and a new test started 4 minutes later.
I’m seeing nothing in the sqlwatch_app_log except tons of these that correlate to the failed blocking process checks:
Determining @check_status for Blocked Process (id: -2). We will try to use baseline data. We have NOT got any baseline data. The @check_status is null. The check value is 1.00000, the warning threshold is (null), and critical threshold is >0. The variance is 1. The final result is CRITICAL.
Any thoughts on what I should look at next? I did spend the better part of yesterday and today reading and trying to understand the process in usp_sqlwatch_internal_process_alerts and usp_sqlwatch_internal_process_actions but nothing as of yet jumped out at me.
Unfortunately, I can’t. For now, I’m wiping everything out and reinstalling so I can confirm this is reproducible and restart troubleshooting with a clean environment. I’ll get back to you with further findings once I have something.
I think I might have found the issue as I could reproduce after reinstalling on a different server.
In usp_sqlwatch_internal_process_actions, getdate() is used in the 4th comparison when trying to set @action_type:
when @check_status <> ‘OK’ and last_check_status = @check_status and (@action_repeat_period_minutes is not null
and datediff(minute,isnull(@last_action_time,‘1970-01-01’),getdate()) > @action_repeat_period_minutes) then ‘REPEAT’
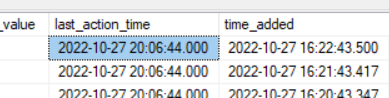
I created a table to dump the pertinent variable values from the procedure. My last_action_time is exposed as:
(time_added is a column I created to record when the record was added to my debugging table)
Testing using the last_action_time with getdate():
I think the difference in the UTC value of last_action_time vs EST value of getdate() is throwing off the case statement so that it almost always returns NONE instead of REPEAT when we want it to. This does kind of explain the erratic behavior of the notifications I was seeing overnight, I think.
I will try updating usp_sqlwatch_internal_process_actions tomorrow, so we’re comparing times in the same time zone and see if that resolves.
Changing getdate() to getutcdate() in usp_sqlwatch_internal_process_actions, line 179, seems to have resolved the major issue. Repeating alerts are usable now , though I still see behavior I don’t understand.
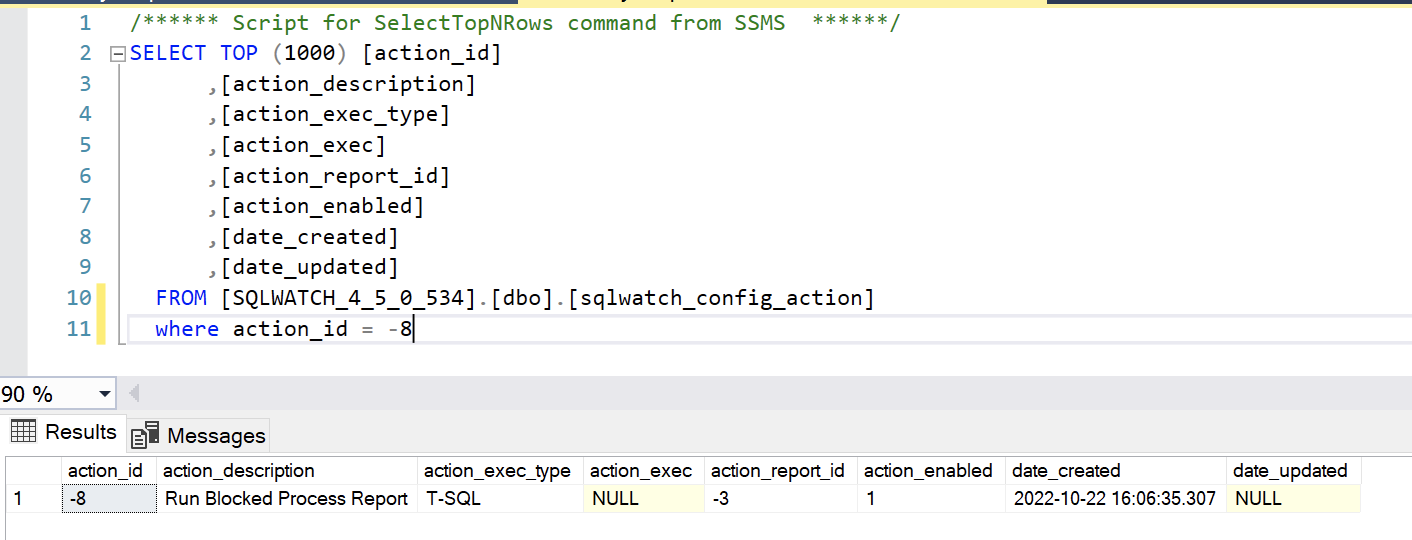
Does action_id -8 (Run Blocked Process Report) also generate its own email notification?
If -8 does, then I’d expect it roughly every minute, while the other should email roughly every 5 min.
What I got was 2 emails roughly every 8 minutes (1 from each check action, I believe).
In the below evidence, 8:01 is when I started my blocking. 8:50 is the recovery (only 1 as expected) after cancelling the blocking.
Think of actions as triggers that run other things. (maybe a trigger would have been a better name, actually)
An action can either run an arbitrary command defined in the [action_exec] field in [dbo].[sqlwatch_config_action], or it can run a report defined in [action_report_id] but never both.
When it runs a report, what happens next is down to the report.
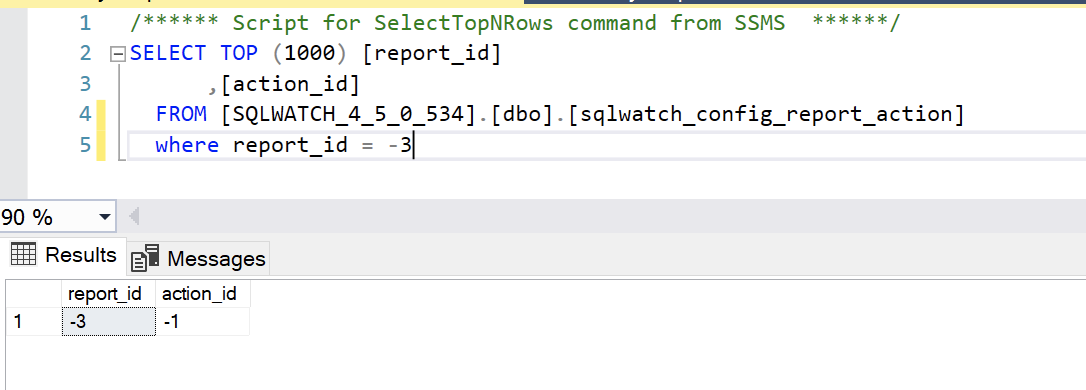
By default, the Run Blocked Process Report action runs report -3:
And action -1 is just a standard email notification.
So, action_id -8 should not send an email directly but should only call the report. However, from your screenshot, I gather the check_id -2 has two actions, one the standard report (via -8) and -1, which is a direct email so you will end up with two emails.
I realise this may be confusing, but the idea behind it was that we could build all sorts of automation on top of it, things like saving reports to disk, calling APIs, interfacing with other tools etc.
Great, thanks! That’s what I was expecting and what I’m seeing, so it makes sense as far as the email count goes.
What doesn’t make sense to me yet is why both actions are being triggered at the same time interval of 8-ish minutes (give or take a few ms), apparently ignoring the action_repeat_period_minutes value in the sqlwatch_config_check_action table.
The action_every_failure=1 would make that happen as it is going to trigger every time it sees the blocking.
How often they trigger depends on how often the Job runs.
The action_repeat_period_minutes was designed for stale checks. For example, if you have low storage and ignore the first alert, it will remind you in x minutes (days ideally).
You may try setting the action_every_failure=0. This should email you the first time the blocking happens, and then the reminder for as long as the blocking is happening.
Btw, I am open for suggestions how to improve this. I wrote the code for the actions “engine” in an evening or so with the idea I had in my head at that time. I think it works well but its not very intuitive.
Unfortunately, I turned those off. Sorry I didn’t get back sooner. This has taken a back burner to other work. I will get back soon as I have anything new to share though.